|
|

Graph by
Gordon E. Kenney, Ph.D.
Licensed Psychologist
Atlanta, Georgia
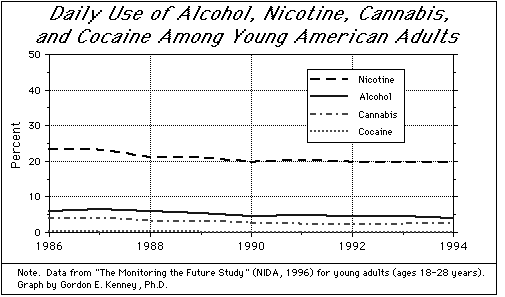
The above graph presents daily substance use data for young American adults (ages 18-28
years) for the years 1986-1994. The graph includes combined data from college and
non-college individuals who participated in the "Monitoring the Future Study"
conducted by the Institute for Social Research at the Universty of Michigan and most
recently published in 1996 by the National Institute on Drug Abuse (NIH Publication No.
96-4027).
The graph indicates that daily use of these four substances has remained relatively steady
during the past nine years, with nicotine representing the substance most used on a daily
basis. Substances
not included in the graph were used on a daily basis by fewer than 0.05% (five
one-hundredths of one percent) of the young adult population in the USA, with the
exception of stimulants which were
used by between <0.05% and 0.3% of this population on a daily basis during reporting
period in question. The inclusion of stimulants in the graph would have obscured the
trends in daily use of cocaine, such as they are.
If the graph presents those substances most used on a daily basis, then one might conclude
that the habitual use of illicit substances is practically non-existent, with the notable
exception of cannabis. The range of daily use of cannabis between 1986 and 1994 was 2.2%
to 3.9%. Such figures certainly do not provide evidence for the "drug menace"
many would have us believe is sweeping the nation. If such conditions were to exist, they
would be most evident among the population of young adults represented in the graph.
So why has there been so much hype about increases in drug use and the high levels of
addiction when they don't really exist? Good question. Perhaps we should ask our elected
representatives just
such a question. They're obviously not reading their own government reports.
|

